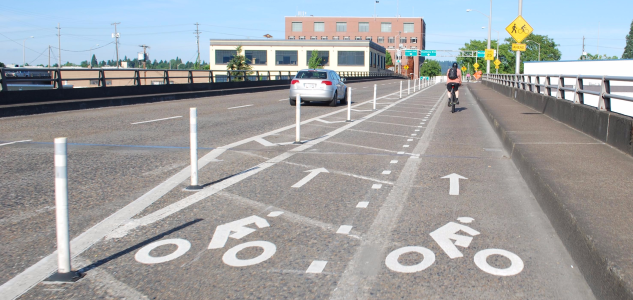
It’s Friday of finals week here, which means I am easily distracted from grading final assignments (aka grading jail). Kara Swisher’s New York Times column titled “Owning a Car Will Soon Be as Quaint as Owning a Horse” was just the right distraction; it relates to my work, so I feel less guilty having it send me off on a data exploration. To make her case, Swisher compares how quickly people made other shifts, e.g. from paper maps to map apps, snail mail to email, and on-demand TV:
Some of the shifts have been slower to develop, but then accelerated quickly, like what is now occurring in retail with online shopping and quick delivery pioneered by Amazon.
Simply put, everything that can be digitized will be digitized.
That is harder to envision with the heavy hunk of metal and fiberglass that is a car, but it is not hard to see the steps. You start using car-sharing services, you don’t use your car as often, you realize as these services proliferate that you actually don’t need to own a car at all.
She does clarify that this is an easier shift to make in major metro areas with lots of alternatives, and she is skeptical about how quickly fully autonomous vehicles will arrive. But, I still questioned her optimism and needed a decent reason to avoid grading. So I went to the US Census website and downloaded data from the 2013 and 2017 5-year American Community Survey on household vehicle ownership (table B08201). After some sorting and merging, I became even less optimistic about how quickly a shift will occur. In fact, most places seem to be going in the opposite direction.
I focused my analysis on the share of households with zero vehicles or one vehicle, and on cities with at least 100,000 households. The margins of error with the ACS data, which I do not show here, make the analysis even more questionable for smaller geographies.
- Of the 25 largest cities (250,000+ households), only five saw an increase in the share of households with zero vehicles: Jacksonville, FL, Indianapolis, IN (the share in IN), San Francisco, Detroit, and Seattle. The others, including New York, Portland, Washington DC (all places with many mobility options) all saw decreases.
- Of the next 52 largest cities (100,000-249,999 households), nine saw an increase in 0-vehicle households: Virginia Beach, Tucson, Toledo, Wichita, Henderson NV, Albuquerque, Tulsa, Arlington VA, and New Orleans.
Now, there are several limitations to this analysis. I’ve already mentioned the margin of errors involved with the ACS samples. The 5-year ACS data cover 2009-2013 and 2013-2017. It may be that some of the effects of new mobility options are not showing up yet, given the 5-year data span. This time period was a time of economic recovery, so the numbers likely reflect growth in employment and income driving vehicle purchases. This trend has been documented by Michael Sivak, who shows that vehicle ownership rates per household increased for three years in a row, from 1.927 in 2013 to 1.968 in 2016, after peaking in 2006 at 2.050 (full report).
Ditching your own vehicle is not easy, because the substitutes are not yet comparable on many criteria. The analogy of paper maps to map apps and cable tv to on-demand are not perfect. Those substitutes are actually better than the original option in many regards. They are more convenient and often cheaper. The alternatives for using your own vehicle, particularly once you have bought it, are usually less convenient and sometimes more expensive (ignoring the true costs, externalities, etc.). There are certain exceptions, primarily denser areas that are congested with limited and/or expensive parking. But even here in Portland, that’s a small portion of the city that only applies to a fraction of all personal travel. I could write more, and do more with the data, but I really should be grading. Here’s the data. I also included 1-vehicle households to see if there are shifts there. Perhaps you have some insights.
Table 1. Largest cities (250,000+ households), Decrease in 0-vehicle households
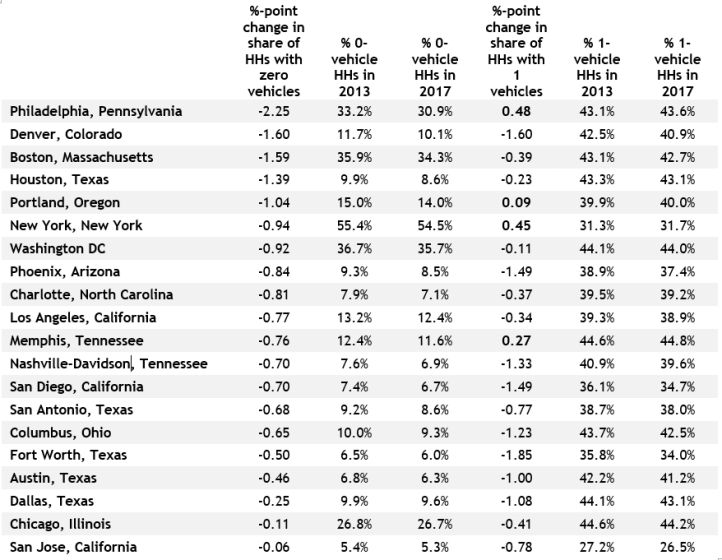
Table 2. Largest cities (250,000+ households), Increase in 0-vehicle households
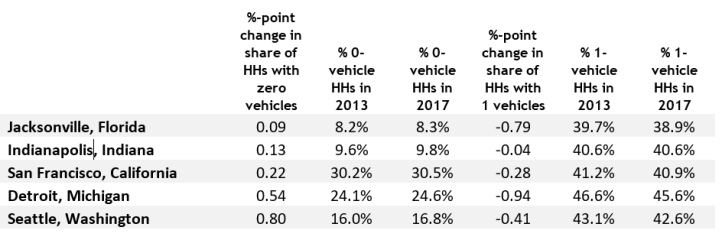
Table 3. Large cities (100,000-249,999 households), Decrease in 0-vehicle households

Table 4. Large cities (100,000-249,999 households), Increase in 0-vehicle households


Thank you. Well written, objective and researched.
LikeLike